Line Chart Widget use for displays information as a series of data points called ‘markers’ connected by straight line segments.
follow the step by step instructions:
Step 1: Use Line Chart
- Go to Menu Romethemekit, and you will be able to see the Line Chart Widget.
- Click Add New Container.
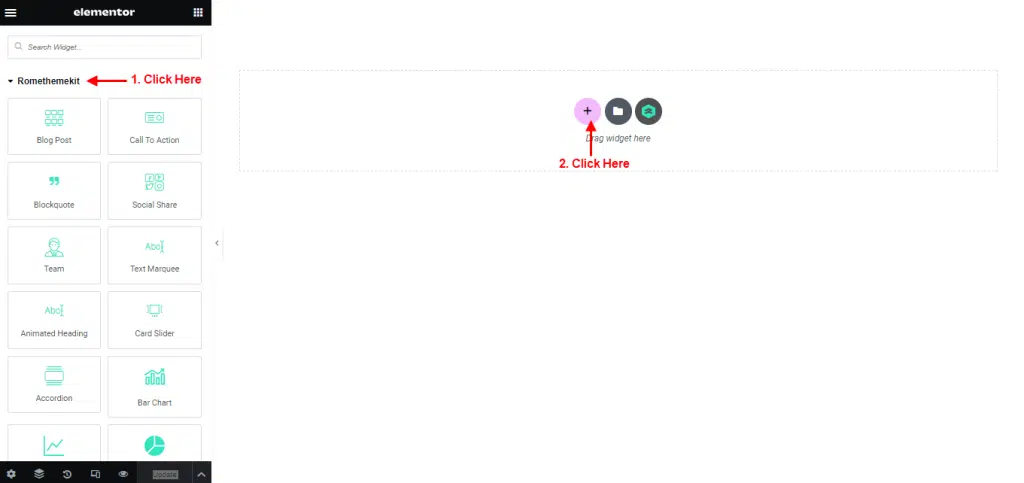
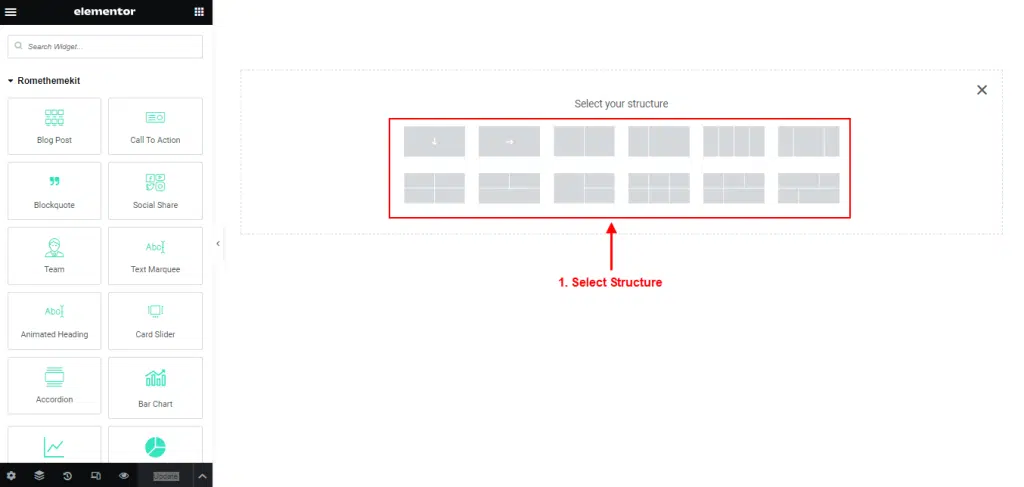
- On the canvas, select your structure.

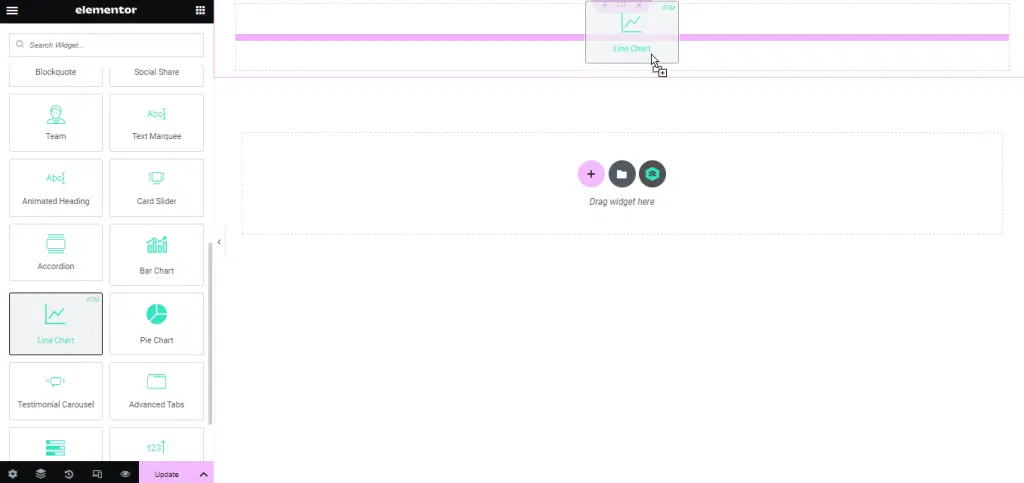
- Drag the widget from the Elementor and Drop it on the selected area.

- Showing Line Chart.
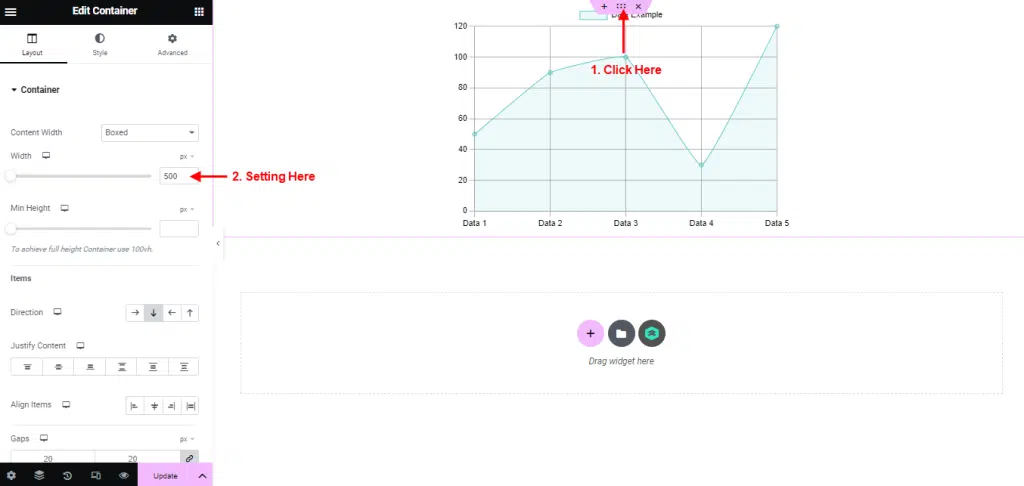
- Click Edit Container.
- You can change Line Chart size in the width column.

Step 2: Customize Line Chart
Content
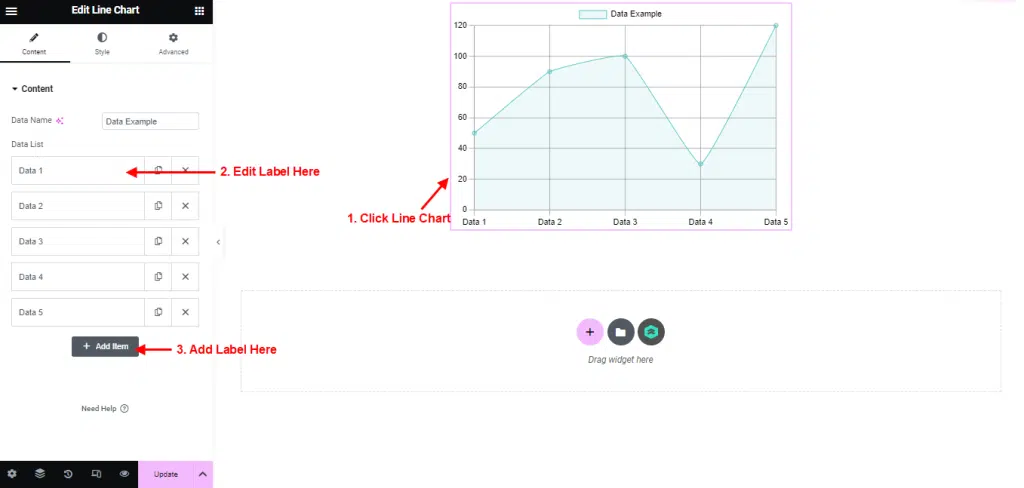
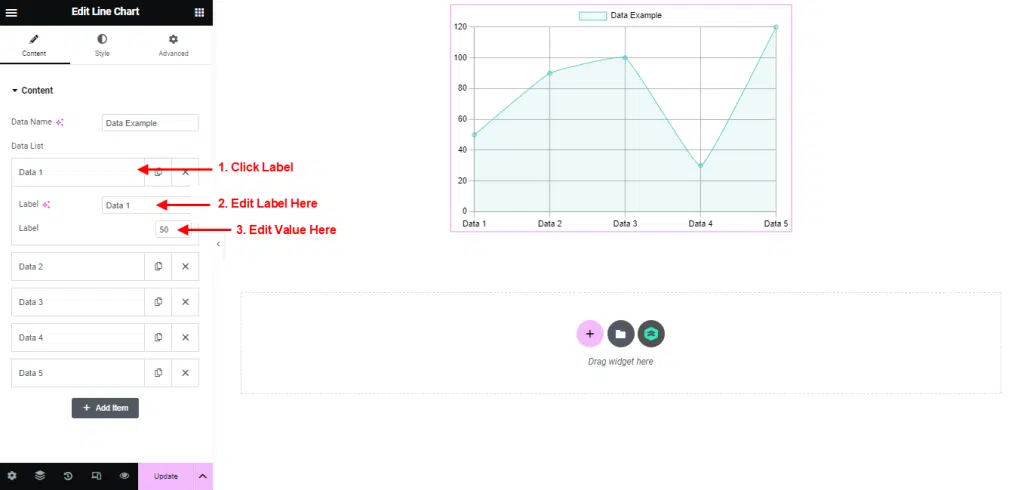
- Click Line Chart.
- The Content section allows you to Edit and Add chart label.

- Click Label to change the label and value.
- You can edit label and value as you need.

Style
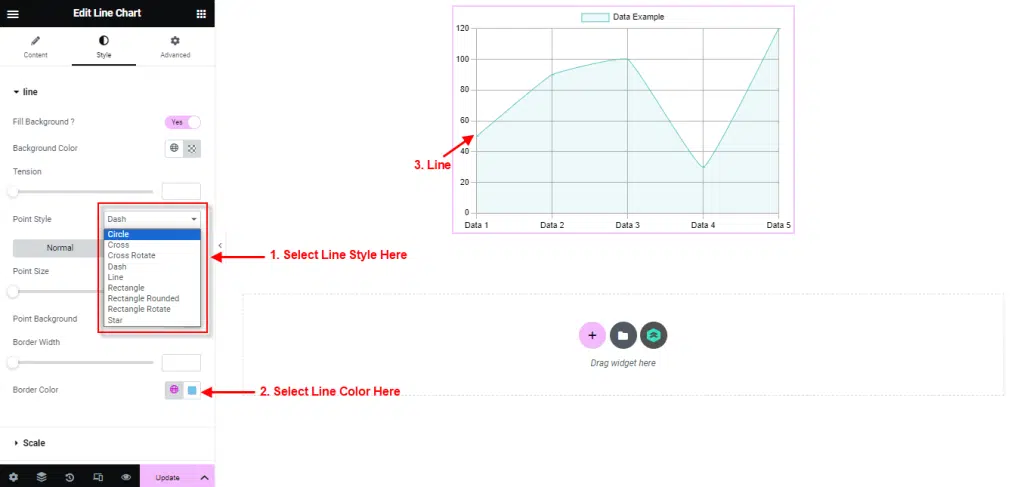
- In Menu Style → click Line.
- You can setting line style and color.
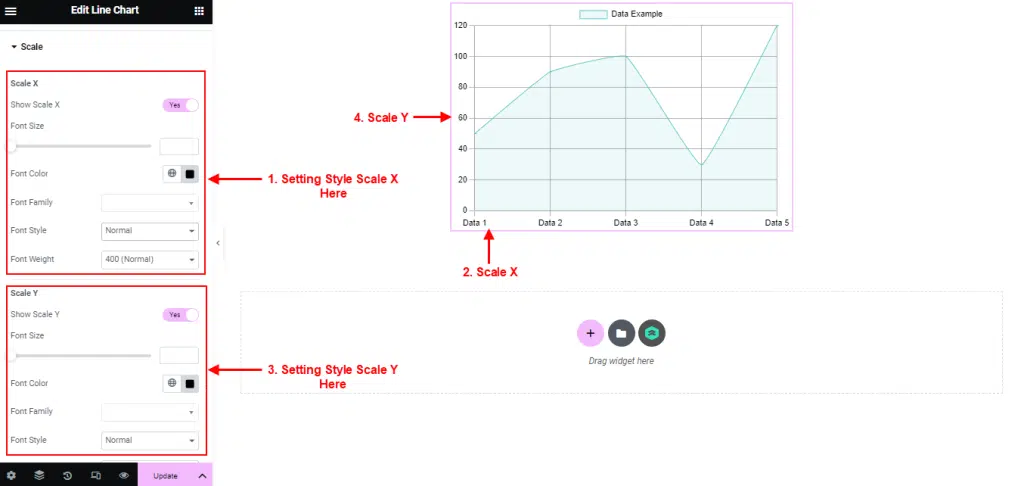
- In Menu Style → click Scale.
- Setting scale x and scale y like the picture below.
- You can customize font size, color and font size.
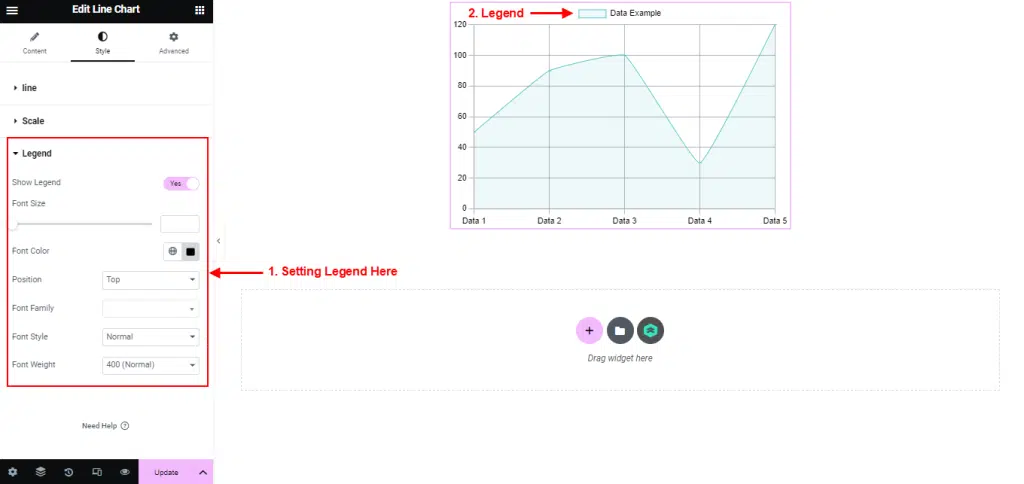
- In Menu Style → click Legend.
- You can customize font size, color, position and font size.