Bar Chart Widget use to perform a comparison of metric values across different subgroups of your data. From a bar chart, we can see which groups are highest or most common, and how other groups compare against the others.
follow the step by step instructions:
Step 1: Use Bar Chart
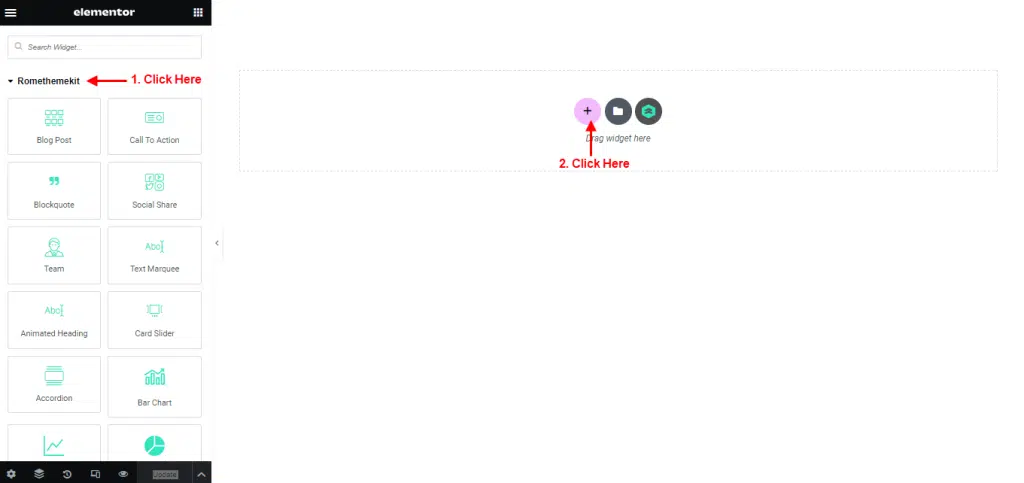
- Go to Menu Romethemekit, and you will be able to see the Bar Chart Widget.
- Click Add New Container.
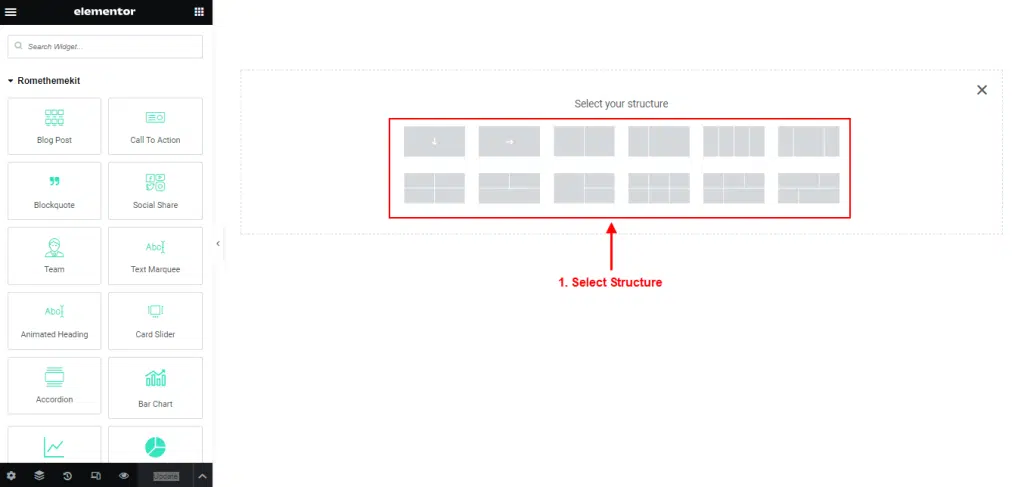
- On the canvas, select your structure.
- Drag the widget from the Elementor and Drop it on the selected area.
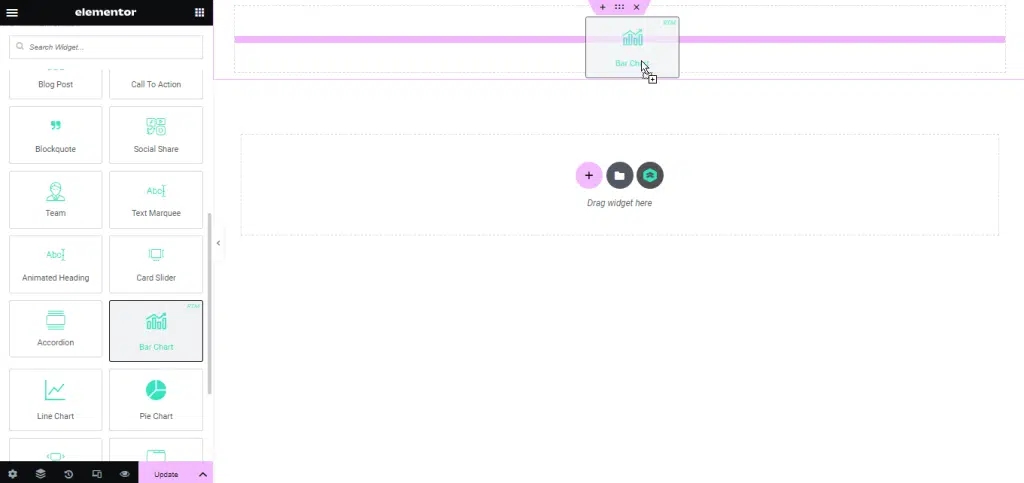
- Showing Bar Chart.
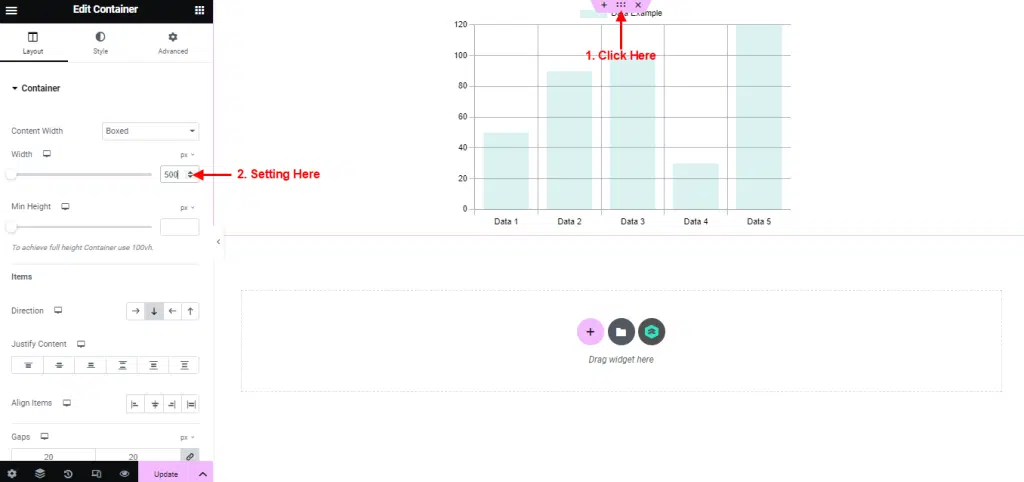
- Click Edit Container.
- You can change Bar Chart size in the width column.
Step 2: Customize Bar Chart
Content
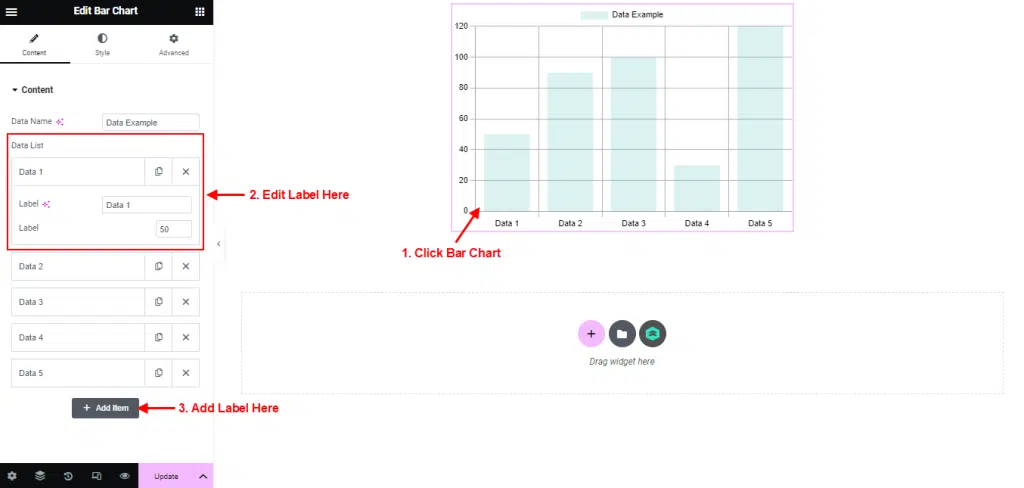
- Click Bar Chart.
- The Content section allows you to Edit and Add chart label.
Style
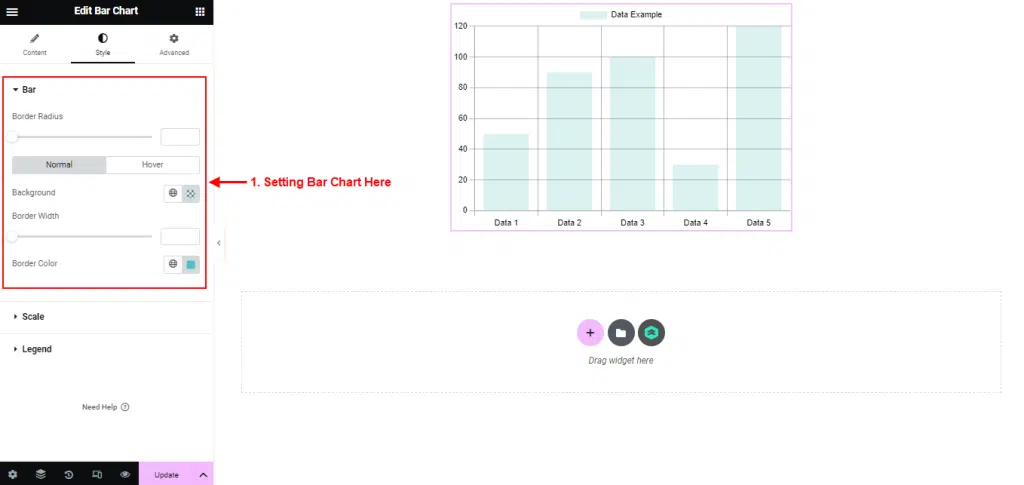
- Select Menu Style → click Bar.
- You can setting border radius, border width, and border color.
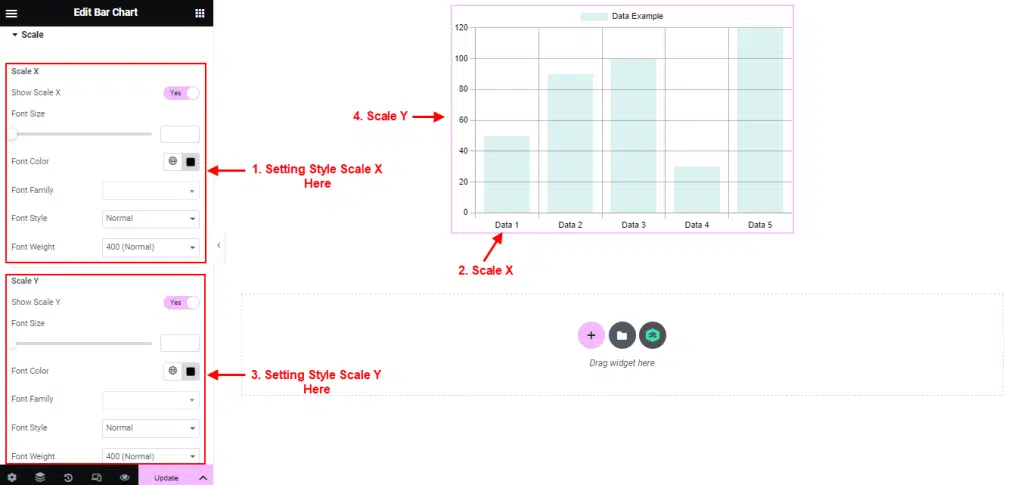
- Select Menu Style → click Scale.
- Setting scale x and scale y like the picture below.
- You can customize font size, color and font size.
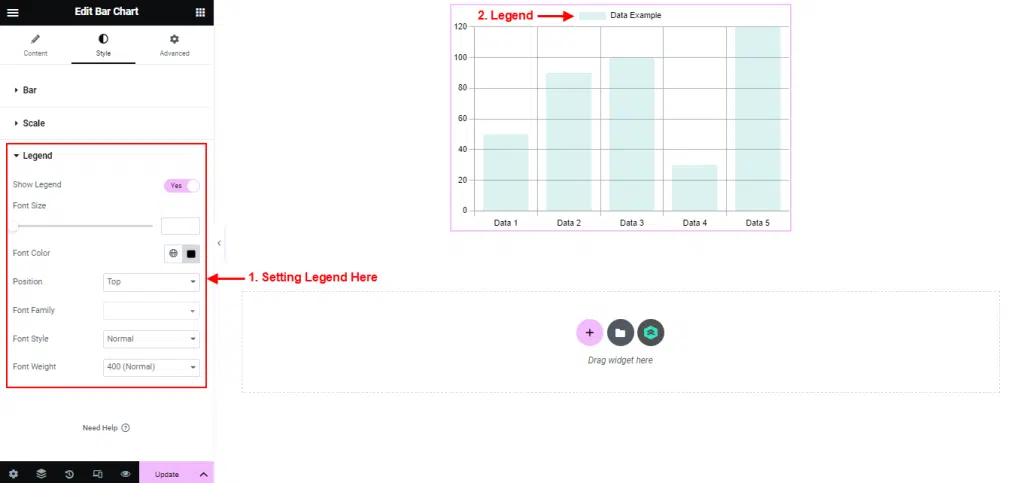
- Select Menu Style → click Legend.
- You can customize font size, color, position and font size.